Imagine if you could go through your house or apartment with your mobile phone and identify how much power each appliance is drawing from the utility grid. This would enable you to replace energy-sapping appliances with energy-saving ones in the future. Now, this is all possible thanks to the new mobile app “EMView”. This tool provides you with an overview of your current energy consumption by visualizing the data sent from an SMA Energy Meter on your own network. The app was developed by Nico Treffkorn and Tobias Frank, the operators of the website www.eb-systeme.de.
If you have further questions or need support of the iOS software EMView, please contact the following help center.
The “EMView” mobile app receives the power consumption data in real time directly from the SMA Energy Meter and displays this data to the user in the form of graphs and tables. Users of the mobile app can move freely about the house with their smartphones and find out the current power consumption of individual appliances by switching them on and off. The graph that is generated also includes all three individual phases for the last 120 seconds. No installation or routing configuration is required. Simply launch the mobile app using your home WLAN network, and it will automatically locate the SMA Energy Meter.
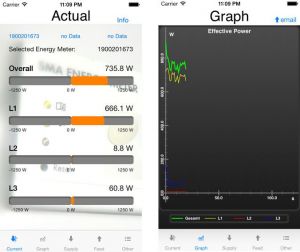
Different screens from the “EMView” mobile app
Interesting real-life applications
As soon as the mobile device is on the same Wi-Fi network as the SMA Energy Meter, all the data is displayed in real time. Alongside real-time analyses of various parameters such as active power and apparent power in the individual phase conductors, the reactive power, voltage and cos phi values are also displayed. A graphical representation of the active power is provided via a 120-second analyses of the data, such as the response when large loads are switched on.
- Follow in real time how the amount of power drawn by a plasma TV varies depending on what is shown on the screen.
- Discover how the apparent power increases at the start of feed-in from a PV system.
- Identify power-hungry devices throughout the home by simply glancing at the app while switching each device on and off.
- Prove that the idea that fluorescent lamps are particularly energy-sapping when they are switched on is a myth as the additional consumption only lasts for milliseconds.
- Are there any unbalanced loads greater than 4.6 kVA in the household?
- Are individual phase conductors subjected to higher loads than others?
- Is the energy storage working accurately, and does it balance power as closely to zero as possible?
Features not normally available even to professionals
The performance data determined in the SMA Energy Meter is displayed virtually in real time in the EMView app. Data is shown both as numerical values and in the form of an active power curve. EMView offers users information that would otherwise not be available, even to professionals.
This includes:
- Total active power in kW; L1, L2 and L3 for grid feed-in and purchased electricity
- Total active energy in kWh for grid feed-in and purchased electricity
- Total apparent power in kVA; L1, L2 and L3 for grid feed-in and purchased electricity
- Total apparent energy in kVAh for grid feed-in and purchased electricity
- Total reactive power in kvar; L1, L2 and L3
- Total reactive energy in kvarh; L1, L2 and L3
- Voltages in V; L1, L2 and L3
- Total power factors cos phi; L1, L2 and L3
A few words from the developers
“While developing a charging system for electric cars with KEBA AG, I soon discovered that, unfortunately, data outputs from the D0 interface of most electronic energy meters provided by power supply companies are imprecise,” explained Nico Treffkorn, one of the developers.
“Either the output intervals are too wide or there is no individual phase analysis. Many of these meters block the power values altogether and only output consumption values. In response to this, I started looking for a smart meter that would work as an extremely compact element in the distribution board. When I was planning my energy storage system, I discovered the SMA Energy Meter and got to know its real-time capabilities. Afterwards, I decoded the protocol so that I would be able to use the data in other systems as well. While I primarily focused on implementation in the charging controller for electric cars, my colleague Tobias Frank started developing the iOS app. We are currently working tirelessly on an Android version.”
“The curiosity to find out exactly what is going on within my own home was the main thing that drove me to develop this app. Especially as the devices are all installed and simply waiting to be used. In particular, I am interested in data reporting and further use of the data from the Sunny Island 6.0H in my home automation systems. So why do all this with the SMA Energy Meter? Because it records what is happening on each phase conductor with accuracy to the nearest second, and it outputs values with accuracy to the nearest watt. What started out as a test evolved into an app suitable for iTunes. The details had to be ironed out a little, and a price had to be set to recover the yearly development costs that are charged by Apple. And that was it. It is really exciting to see how Sunny Island balances the phase conductors and how the power consumption is directly affected during cooking, operation of the heat pump or simply when a hairdryer or vacuum cleaner is switched on. I would say it took about 2 weeks in total to program everything, but my wife claims it took twice that long. I think that is probably the more realistic estimate  ,”
,” said second developer Tobias Frank with a smile.
FAQs
When I launch the app, it fails to locate an SMA Energy Meter. Why is this?
- Is the SMA Energy Meter connected to the home network?
- Some routers and switches have an active multicast filter set up by default. Deactivate the filter on the website of the router or using the configuration software from the manufacturer (e.g., using the Prosafe Plus Utility for a Netgear Prosafe Plus Switch).
- Are you using power-line communication products (e.g., Devolo dLAN)? Not all manufacturers of power-line communication adapters support the transport of multicast packets via the utility grid. Make sure the latest software version is installed on the Devolo products to ensure that multicasting is supported.
I am experiencing various reception problems. What can I do?
- The SMA Energy Meter sends data as a multicast across its own, private network via the 9522 UDP port. Reception problems occur, for example, if a power-line communication adapter is used between the Energy Meter and an iPhone. The iPhone must be on the same Wi-Fi network as the Energy Meter. Some intelligent network switches filter out multicast data packets. This function can usually be deactivated in the user interface of the network switch.
Does that mean I have to enable port 9522 in the router?
- Definitely not. The router is only used to establish a connection to the Internet. The SMA Energy Meter data packets remain exclusively within the private home network.
How can you tell whether or not the SMA Energy Meter is working correctly on the network?
- You can use the program Wireshark, for example, to check that the data packets are being properly routed.
How many SMA Energy Meters can be supported at the same time?
- Up to 3 SMA Energy Meters can be supported at the same time.
Is it possible to record the data and use it for further analysis?
- Unfortunately not. Data is received directly in real time, and the app allows you to display 120-second periods in the form of a graph. Unfortunately, it is not currently possible to archive the data for subsequent analysis.
Availability
To date, the EMView app is available for Apple iOS operating systems on the iPhone, iPod touch and iPad. There will also be an Android version in the near future. However, this is much more complex both in terms of development and quality control as there is a lot of hardware and software variation with Android and it is vital to ensure that the app will work flawlessly on all Android smart devices.
- See more at:
http://en.sma-sunny.com/2014/03/21/emview-power-consumption-data-in-real-time/#sthash.wAZpUGIs.dpuf
http://en.sma-sunny.com/2014/03/21/emview-power-consumption-data-in-real-time/